
In 2011, Bill Haas came into the Tour Championship ranked 25th in the FedEx Cup. In order to win the FedEx Cup and take home the $10 million first place prize, he only needed to win the Tour Championship, have the #1 seed finish 19th or worse, the #2 seed finish in a 3-way tie for fifth or worse, the #3 seed finish fourth or worse, the #4 seed finish T3 or worse, the #5 seed finish in a 3-way tie for second or worse and the #6 seed finish T2 or worse. Thanks to a miraculous shot out of the water in a playoff and a whole lot of help from his competitors, Bill Haas won the Tour Championship and the FedEx Cup, narrowly edging out #1 seed Webb Simpson, who finished in 22nd.
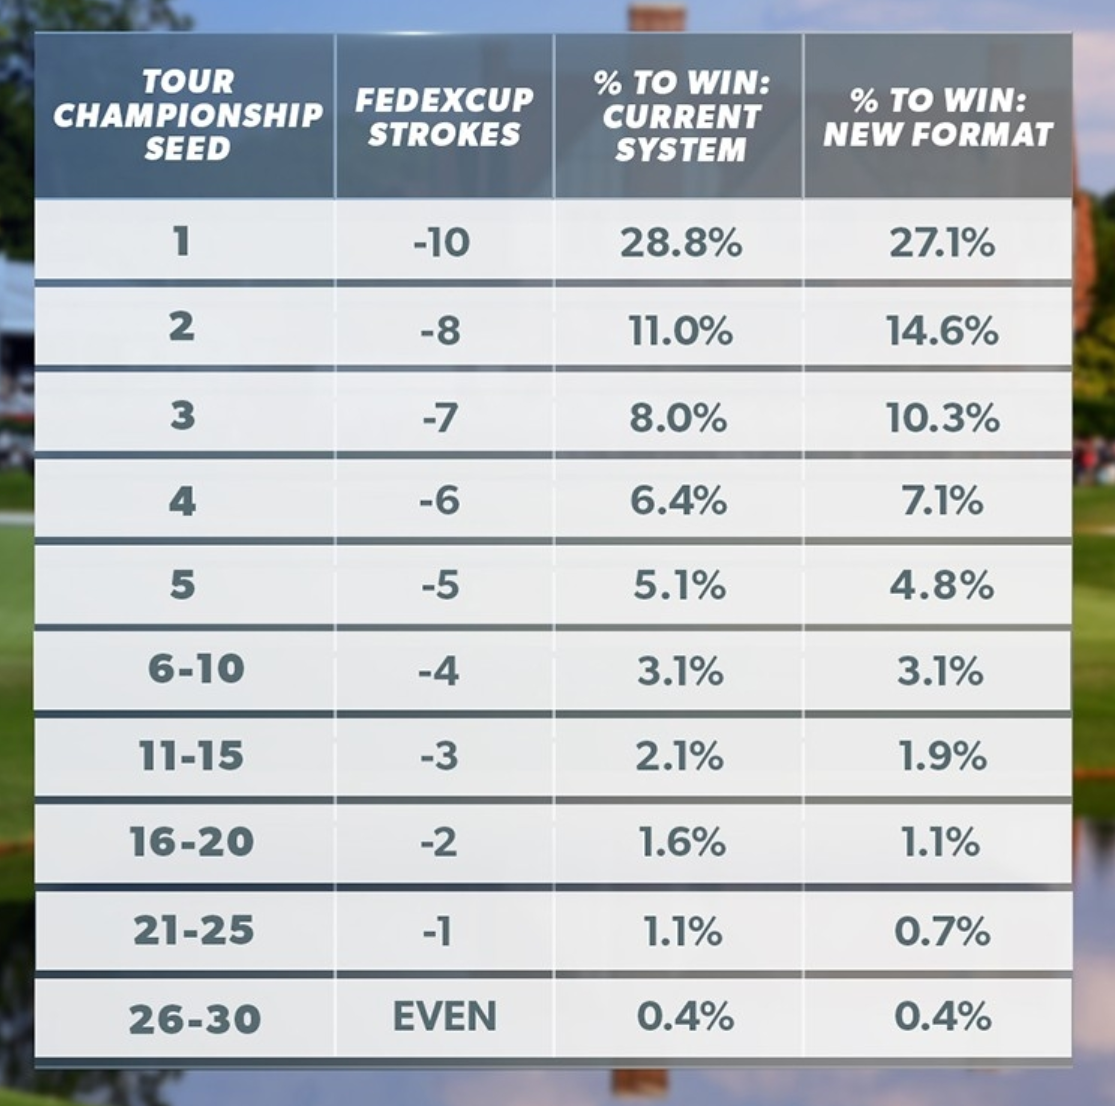
It was a remarkable victory that was particularly hard to follow given the points structure of the FedEx Cup. Haas had wrongly congratulated Luke Donald at the end of regulation on winning the Cup and didn’t realize he had won until the trophy was about to be handed out. The new change to the playoff system was designed primarily to make the scoring easier for fans to track, while maintaining similar win probabilities as before:
The tour maintained that win probabilities would remain roughly constant between the two systems, but I wanted to conduct my own investigation into the effects of the changes. The simplest way to analyze the problem is to take the two playoff formats, assume everyone has equal skill and simulate a large number of Tour Championships. More technically, in this case, I gave everyone a mean score of 0 (even) and a standard deviation of 3 strokes. This means, as per a standard bell curve, 95% of scores each round will be between -6 and +6. Below are the results from the equal skill simulation:

The difference in the #1 seed’s chances of winning is massive! How is this possible? In the old system the #1 seed has a point cushion to begin the Tour championship, which effectively meant that everyone other than the top 5 seeds, who controlled their own destiny, needed the #1 seed to play poorly. Recall that Bill Haas needed Webb Simpson to finish worse than 19th to even have a chance. A maximum of a ten-stroke lead on the other hand is much easier to overcome; that can sometimes just be the difference between 1st and 2nd when someone like Tiger Woods blitzes the field. By the same logic, #30 needs the #1 seed to finish in 29th or worse to have a chance at winning in the old system, so it makes sense that his odds have improved with the stroke-based system.
This is still a crude simulation; in real life, the #1 seed would likely be significantly better than the #30 seed. How can you estimate the skill levels of seeds 1 through 30? Do you just assume that #1 is the best and #30 is the worst? That will not always be the case; after all, most would argue that Brooks Koepka is the best player this season, but he’s been passed for #1 by Justin Thomas, who before his win at the BMW Championship hadn’t had a top ten since February. Can you assume that the players are ordered by skill at the end of the regular season? This may be a closer approximation, but again there are many counterexamples. Instead, I assumed that players have a baseline skill level at the beginning of the season and then play a series of events where randomness somewhat hides how good players actually are. Over the past 11 seasons, this is the distribution of strokes gained at the end of the season for all players (removing Mr. Outlier, Tiger Woods):
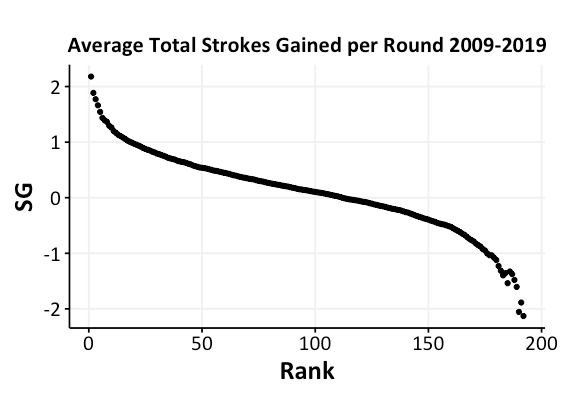
The best player usually gains just over 2 strokes per round, #110 is about tour average and gains 0 strokes per round, while the worst on tour lose 2 strokes per round against the field. My goal is to simulate a large number of seasons with an underlying skill distribution that produces end-of-year strokes gained totals that match real life. For simplicity, I simulated a 20-tournament season where the same 150 golfers played every week. With a bit of trial-and-error, I came up with an underlying skill for the 150 golfers that produced the following red curve1.
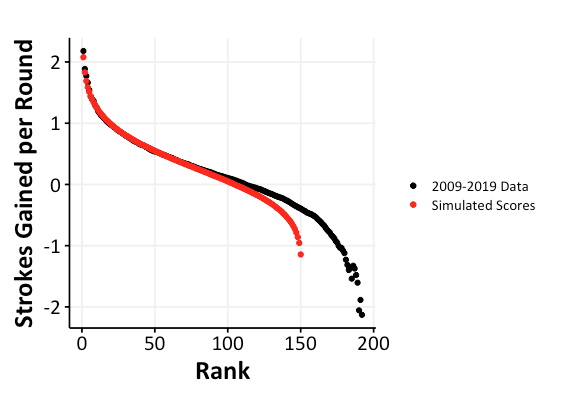
There’s clearly a bit of simplification done by fielding a 150-man PGA Tour rather than approximately 190 players, as in real life, but given the emphasis on FedEx Cup performance I’m happy to see that the simulated top players match up well with reality. From here we can simulate many seasons under both playoff formats and analyze the results.
Before spoiling the punch line, I want to examine the skill levels of the 1 through 30 seeds that made it to the simulated Tour Championship.
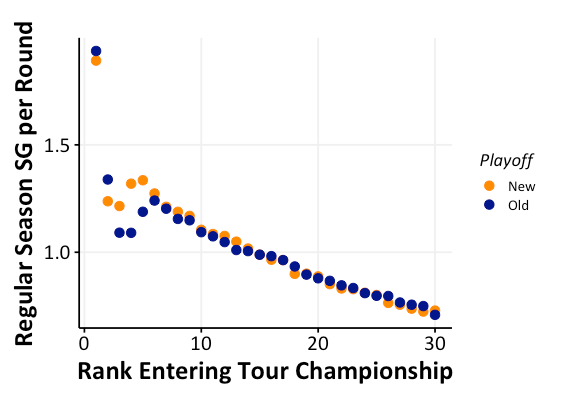
The two systems prior to the Tour Championship are almost identical; playoff points are still quadrupled relative to the regular season, but the new format has two events instead of three prior to the finale. Seeds 6 through 30 are very similar between the two formats. In both cases, the bottom 25 players averaged +0.94 strokes per round in the regular season. However, it’s a different story for the top 5 seeds. One more event gives more of an opportunity for a random lower seed to win a quadruple point event and vault into the top 5. Sometimes the top seed has built too big of an advantage during the regular season, but the next 2-3 seeds can often be overtaken.

In the graph above, the typical player entering the tour championship in 5th position tended to have a solid 3rd or 4th position regular season that would get nudged down by the two playoff event winners. On the other hand, the players entering the tour championship in 3rd position could have found their spot in a variety of ways. A couple options are either having a mediocre regular season saved by a playoff win (Patrick Reed) or having a standout regular season only to be passed by one or two playoff winners (Brooks Koepka). Overall, though, the additional playoff event in the old system knocks down the average quality of the top five players from +1.40 strokes per round to +1.33.

However, the main factor that differentiates the two systems is clearly the Tour Championship points structure, or the strokes structure in the new system.

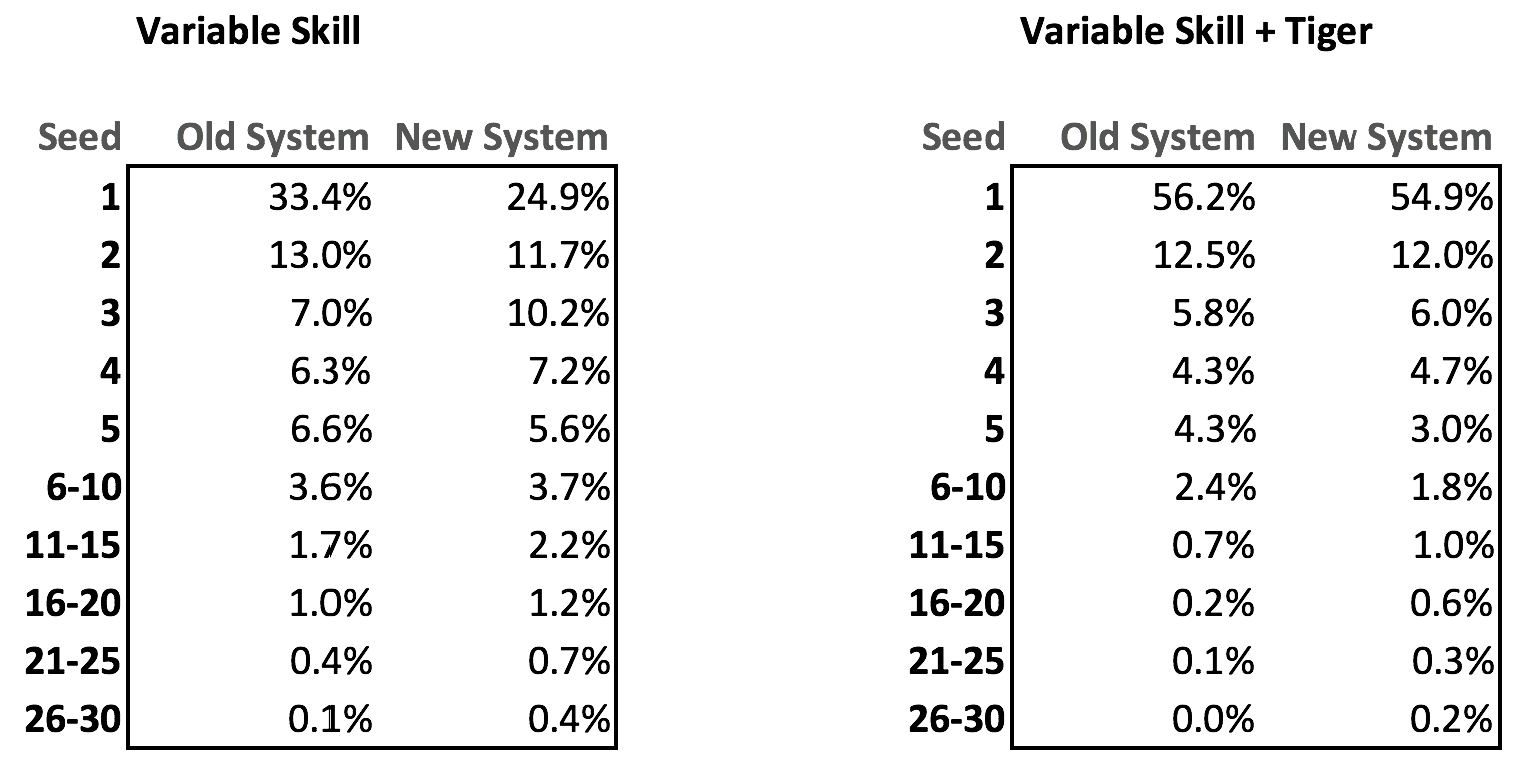
Introducing skill clearly benefits the higher seeds. The #1 seed’s win percentage jumps from 31.3% to 33.4% in the old system and goes from 20.8% to 24.9% in the new system. Interestingly, despite the lower overall win percentage for the #1 seed in the new system, I would argue that it allows for skill to shine through more. The old point system gives an artificial bump that allows the #1 seed to win the FedEx Cup with a mediocre performance as long as a low enough seed wins the Tour Championship. As a result, the introduction of skill to the model only increased winning percentage by 2.1%. In the new stroke system, a good performance is almost required for the #1 seed to win, so skill provides more of an advantage, increasing winning percentage by 4.1%. For the bottom 15 seeds, their decreased skill relative to the field dropped their cumulative winning percentage from 13.6% to 7.4% in the old system and from 18.0% to 11.3% in the new system. Despite the drop, the new system still gives the lower seeds an increased chance of pulling off the big upset – and thus a more exciting finish.
With this underlying skill model driving our simulations, we can ask some fun questions. What would happen if peak Tiger was allowed to play in both playoff systems? He has a few seasons on record where he gained over 3 strokes per round on the field. For these simulations, I’ll give him a true skill of +3.0 strokes per round, which amounts to almost a one shot per round advantage over the next best player. This level of advantage over second-best has occurred in multiple real-life Tiger seasons.
It’s quickly clear that Tiger is breaking the system. The #1 seed is dominating both playoff formats, but more importantly, peak Tiger is not necessarily the one seed every time. We need to dig deeper into the data.

Simulated “Peak Tiger” wins 17% of regular season events. This is lower than his actual career win percentage of 23%. Every simulated event is against the 150 best PGA Tour players, which is comparable to playing the Players Championship twenty times in a season. The Players Championship is one of the hardest events to win every year, so it’s understandable that Tiger’s simulation win rate is slightly lower than his real-life rate. The second-best player wins 5% of his starts with Tiger in the field and 6% of his starts without Tiger. This is a similar clip to Vijay Singh, Ernie Els, Adam Scott and Dustin Johnson; all players who have been world number one. In general, peak Tiger is devastating news for Mr. Second Best; his chances of winning the regular season crown drops from 35% to 3% and his FedEx Cup title chance drops from 20% to 10%. Players like Ernie Els and Phil Mickelson were really unlucky to face off against Tiger in his prime.

Tiger wins the regular season title an astounding 95% of the time, which is why he’s almost a lock to win player of the year when he’s on form. Interestingly, the two playoff formats don’t show much of a difference; he will win the Fedex Cup in both formats almost 60% of the time. This highlights the variability that the playoff system brings; Tiger’s grip on number one falls from 95% to 88% to 59% as we advance from the end of the regular season to the start of the TOUR Championship to crowning the FedEx Cup champion.
Lastly, there’s a 12% chance of a sudden-death playoff for the FedEx Cup, compared to a 0.3% chance in the old system. I’m saying there’s a chance a single hole will determine whether a golfer takes home the $5 million second place prize or the $15 million first place bounty. One hole possibly determining the fate of $10 million almost puts the 18-hole $9 million Tiger vs. Phil event to shame – and would make for absolutely incredible television at a time when golf can get the sports world’s attention.

The PGA Tour’s new system makes the FedEx Cup easier to follow, provides more of an opportunity for skill to shine and deservedly take home the title, increased the chance of a playoff to determine the fate of $10 million and allowed for underdogs in the bottom half of the pack to have a greater chance at stealing victory. Writing the night before a shot is even hit, I’m a fan of the new system.


